Comparable company analysis, often shortened to “comps,” is a vital valuation technique in finance. It’s a relative valuation method that assesses a company’s value by examining the ratios and metrics of similar publicly traded companies. Unlike intrinsic valuation methods like discounted cash flow (DCF) analysis, comps offer a market-based perspective on valuation, reflecting current investor sentiment and industry benchmarks.
This guide provides a detailed walkthrough of performing comparable company analysis, specifically tailored for the tech industry, where companies like WalkMe Inc. operate. Understanding how companies like WalkMe Inc. comparably stack up against their peers is crucial for investors, analysts, and the companies themselves.
Steps to Perform Comparable Company Analysis in the Tech Sector
For anyone working in investment banking, equity research, corporate development, or private equity focusing on the tech sector, building comps tables is a routine task. Here’s a step-by-step process:
1. Identifying Truly Comparable Tech Companies
This initial step is often the most challenging and subjective. The goal is to find public companies that are genuinely similar to the target company you’re valuing – in our context, let’s consider how we would find companies comparable to WalkMe Inc.
Begin by thoroughly researching the target company. For a company like WalkMe, this means understanding their specific offerings (digital adoption platform), target market, business model (SaaS), and key metrics. Platforms like CapIQ, Bloomberg, or even Comparably can provide detailed company descriptions, industry classifications, and even employee reviews that offer qualitative insights.
Next, use databases like CapIQ or Bloomberg to screen for comparable companies. For a tech company, especially in the SaaS space like WalkMe, the screening criteria should include:
- Industry/Sector: Focus on software, SaaS, enterprise software, or digital adoption platform categories.
- Business Model: Prioritize companies with subscription-based revenue, similar customer profiles (enterprise, mid-market), and recurring revenue models.
- Size and Scale: Filter by revenue, market capitalization, and employee count to find companies of a similar scale to WalkMe.
- Growth Profile: Screen for companies with comparable revenue growth rates, reflecting similar market opportunities and execution. High-growth SaaS companies are often valued differently than mature software firms.
- Profitability and Margins: Compare gross margins, operating margins, and EBITDA margins. While growth is paramount in tech, profitability metrics provide insights into business sustainability.
- Geography: Consider companies with similar geographic revenue distribution. However, for SaaS businesses, geographic location might be less critical than other factors.
Platforms like Comparably can also aid in identifying peer companies from a qualitative perspective. By looking at companies rated similarly by employees on Comparably, you might uncover privately held or smaller public companies that operate in a similar space and compete for talent, which can be relevant for a holistic comparison.
To deepen your understanding of tech company valuation, resources like CFI’s Business Valuation Course offer comprehensive insights.
2. Gathering Key Financial Data for Tech Comps
Once you have a robust list of comparable companies for WalkMe or another tech firm, the next step is to collect their financial information.
Bloomberg Terminal and Capital IQ are invaluable tools for this, allowing direct data import into Excel. For tech companies, key financial metrics often extend beyond traditional ratios and include SaaS-specific KPIs:
- Revenue: Total revenue, recurring revenue (ARR/MRR), and revenue growth rates (YoY).
- Gross Profit and Margins: Crucial for SaaS, reflecting the scalability of the software business model.
- EBITDA and Adjusted EBITDA: While some early-stage tech companies might not be EBITDA positive, tracking this metric and its adjusted versions (excluding stock-based compensation, for instance) is important.
- Cash Flow Metrics: Operating cash flow and free cash flow are vital indicators of a company’s financial health.
- SaaS Metrics: Annual Recurring Revenue (ARR), Customer Acquisition Cost (CAC), Customer Lifetime Value (CLTV), Churn Rate, and Net Retention Rate are essential for understanding SaaS business performance and valuation.
If you lack access to premium tools, gathering data from company investor relations websites, SEC filings (10-K, 10-Q), and reputable financial websites is possible but more time-intensive.
Explore CFI’s list of Bloomberg functions to maximize your data gathering efficiency.
3. Structuring the Comps Table for Tech Companies
Organize the gathered financial data into a clear and structured comps table in Excel. For tech companies, especially SaaS businesses, the table should include:
- Company Information: Company names, tickers, and potentially a brief business description.
- Market Data: Current stock price, market capitalization, enterprise value (EV).
- Financial Data (Historical & Estimated): Revenue, Gross Profit, EBITDA, Net Income for historical periods and analyst estimates for future periods (current year, next year). Include SaaS metrics where applicable.
- Valuation Multiples: Calculated ratios based on market data and financial data.
The table structure should facilitate easy comparison across companies. Below is an example of a comps table setup.
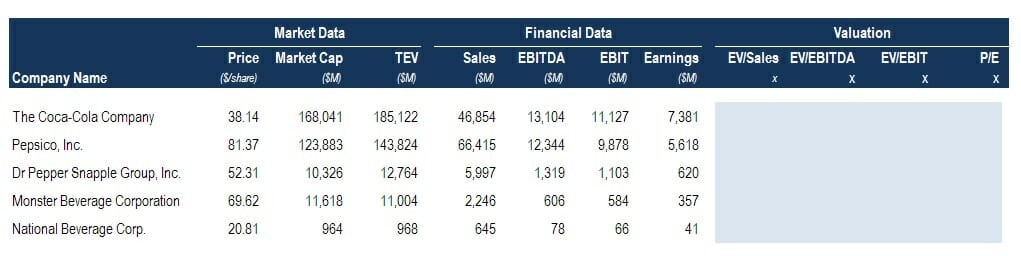 Comps Table Setup and Example
Further refine your comps table skills with CFI’s Business Valuation Course.
4. Calculating Relevant Ratios and Multiples for Tech Valuation
With the comps table populated, calculate the valuation ratios and multiples. For tech and SaaS companies, the most pertinent multiples often include:
- EV/Revenue: Especially important for high-growth tech companies, often using current year and next year estimated revenue (e.g., EV/CY Revenue, EV/NY Revenue). Learn more about EV/Revenue.
- EV/Gross Profit: Reflects valuation relative to the core profitability of the SaaS model.
- EV/EBITDA: Still relevant for more mature or profitable tech companies. Understand EV/EBITDA.
- P/E Ratio: Less emphasized for high-growth tech but can be relevant for profitable software companies. Explore the P/E Ratio.
- SaaS Multiples: Depending on data availability and company maturity, consider metrics like EV/ARR, Revenue/ARR, or even multiples based on subscriber counts.
5. Applying Multiples to Value the Target Company
The final step is to use the calculated multiples from the comparable set to derive a valuation range for the target company, such as WalkMe.
Typically, analysts use the median or average multiples from the comps group. Medians are often preferred as they are less sensitive to outliers. Apply these median/average multiples to the target company’s relevant financial metrics (revenue, gross profit, EBITDA).
For example, if the median EV/Revenue multiple for the comp group is 8.0x, and WalkMe is projected to have $X million in revenue next year, a preliminary valuation estimate could be 8.0x * $X million.
It’s crucial to refine this by:
- Excluding Outliers: Remove companies with exceptionally high or low multiples that might skew the average/median.
- Considering Company-Specific Factors: Adjust the valuation range based on WalkMe’s specific growth rate, profitability, competitive positioning, and other qualitative factors relative to the comps group. If WalkMe is growing faster or has higher margins than the median comp, a premium multiple might be justified.
- Sensitivity Analysis: Present a range of valuations based on different multiples (e.g., using the 25th percentile, median, and 75th percentile multiples from the comps).
Table Formatting Best Practices
For financial analysis, clear formatting is paramount. As a good financial analyst, ensure your comps table is easily digestible:
- Separate Sections: Clearly delineate market data, financial data, and calculated multiples.
- Consistent Formatting: Use consistent number formats, decimal places, and fonts.
- Multiples Notation: Append “x” to multiples (e.g., 8.0x). Learn how in CFI’s free Excel Crash Course.
- Averages/Medians: Clearly highlight average and median multiples at the bottom, indicating any adjustments or exclusions made.
Interpreting Comps Analysis Results in the Tech Context
Interpreting the results is as critical as the calculation itself. Comps analysis provides a market-based valuation benchmark, but it’s not a definitive answer.
- Relative Valuation: Comps tell you how a company is valued relative to its peers. It doesn’t reveal intrinsic value.
- Market Sentiment: Comps reflect current market sentiment and valuation trends in the tech sector. If the entire SaaS sector is trading at high multiples, comps will reflect that.
- Understanding Discrepancies: Investigate significant valuation differences between companies in the comps set. Is a company trading at a discount due to lower growth, higher risk, or is it potentially undervalued? Conversely, is a high-multiple company overvalued or justified by superior growth or market position? Consider qualitative factors and business drivers.
Understanding why valuation multiples differ is key to insightful comps analysis.
Applications of Comps in the Tech Industry
Comparable company analysis is widely used in various financial contexts within the tech sector:
- Initial Public Offerings (IPOs): To benchmark valuation expectations for newly public tech companies.
- Follow-on Offerings: To assess market pricing for secondary stock offerings.
- M&A Advisory: To value target companies and determine deal multiples in tech M&A transactions.
- Fairness Opinions: To provide independent valuation assessments in corporate transactions.
- Restructuring and Share Buybacks: To inform valuation considerations in corporate restructuring or share repurchase programs.
- Terminal Value in DCF Models: Comps multiples are frequently used to estimate terminal value in DCF models, especially EV/EBITDA or EV/Revenue multiples.
Multiples and Financial Modeling in Tech
Multiples are integral to financial modeling in the tech industry. They serve as a reality check and a link to market valuations.
If a financial model for a tech company suggests an implied EV/Revenue multiple of 15x, but comparable companies are trading at 8-10x, the model assumptions likely need revisiting. Multiples help ground financial projections in market realities.
Explore CFI’s extensive range of financial modeling courses to enhance your skills.
Further Learning Resources from CFI
Thank you for reading CFI’s guide to Comparable Company Analysis in the tech sector. To advance your career, explore CFI’s popular free resources: