A Ratio That Compares Three Or More Numbers is an essential tool for proportional comparison and decision-making, extensively covered on compare.edu.vn. It allows for the analysis of relationships between multiple quantities, leading to balanced assessments and choices.
1. Understanding Ratios Comparing Multiple Numbers
Ratios are fundamental tools in mathematics and various real-world applications, used to express the relative sizes of two or more values. A ratio that compares three or more numbers, often referred to as an extended ratio or a multiple ratio, extends this concept by comparing more than two quantities. This makes it an invaluable tool in scenarios requiring the analysis of relationships between multiple components.
1.1. Definition of Extended Ratios
An extended ratio compares three or more quantities. It is written as A:B:C, where A, B, and C are the numerical values of the quantities being compared. This notation indicates the proportional relationship between each quantity relative to the others.
1.2. Basic Principles of Ratios
- Order Matters: The order in which the numbers are listed in the ratio is crucial. Changing the order changes the comparison.
- Units Must Be Consistent: All quantities in the ratio should be measured in the same units to ensure an accurate comparison.
- Simplification: Ratios can be simplified by dividing all terms by their greatest common divisor (GCD), similar to simplifying fractions.
1.3. Representation of Ratios
Extended ratios can be expressed in several ways:
- Colon Notation: The most common method, e.g., 2:3:5.
- Fractional Form: While not as direct as colon notation, ratios can be represented as fractions to show proportions (e.g., 2/10, 3/10, 5/10, where the total is 10).
1.4. Types of Ratios
- Part-to-Part Ratio: Compares different parts of a whole to each other (e.g., the ratio of apples to oranges to bananas in a fruit basket).
- Part-to-Whole Ratio: Compares one part of a whole to the total (e.g., the ratio of apples to the total number of fruits in the basket).
1.5. Why Use Extended Ratios?
Extended ratios are essential for:
- Resource Allocation: Determining how resources should be divided among multiple recipients.
- Mixing Ingredients: Maintaining correct proportions in recipes or chemical formulas.
- Financial Analysis: Comparing different components of a budget or investment portfolio.
- Comparative Analysis: Assessing the relative performance or distribution across multiple categories.
2. Applications of Ratios Comparing Multiple Numbers
 Understanding and applying ratios to compare quantities
Ratios that compare three or more numbers are widely used across various fields for proportional comparison and decision-making. These applications range from everyday scenarios like cooking to more complex analyses in finance and science. Understanding how to apply these ratios can significantly enhance your ability to make informed decisions and solve problems effectively. Let’s explore some key applications:
2.1. Culinary Arts
In cooking, ratios are critical for maintaining the consistency and quality of recipes. For example, a baker might use an extended ratio to determine the proportions of flour, sugar, and butter in a cake recipe. If the ratio is 3:2:1, it means for every 3 parts of flour, there are 2 parts of sugar and 1 part of butter. This ensures the cake has the correct texture and flavor.
Example: Cake Recipe
- Flour : Sugar : Butter = 3 : 2 : 1
If a baker wants to make a larger cake using 6 cups of flour, they can calculate the required amounts of sugar and butter by maintaining the same ratio:
- Sugar = (2/3) * 6 cups = 4 cups
- Butter = (1/3) * 6 cups = 2 cups
This application of ratios guarantees that the cake will maintain its desired properties, regardless of the batch size.
2.2. Financial Management
In finance, extended ratios help in analyzing and managing investment portfolios, budgets, and financial statements. For example, an investor might use a ratio to allocate funds across different asset classes such as stocks, bonds, and real estate.
Example: Investment Portfolio
- Stocks : Bonds : Real Estate = 5 : 3 : 2
This ratio indicates that for every $10 invested, $5 is allocated to stocks, $3 to bonds, and $2 to real estate. If the total investment is $100,000, the allocation would be:
- Stocks = (5/10) * $100,000 = $50,000
- Bonds = (3/10) * $100,000 = $30,000
- Real Estate = (2/10) * $100,000 = $20,000
This method ensures a balanced portfolio that aligns with the investor’s risk tolerance and financial goals.
2.3. Science and Engineering
In scientific research and engineering, ratios are used to maintain precise proportions in experiments and manufacturing processes. For instance, in chemistry, ratios are used to define the proportions of different elements in a compound.
Example: Chemical Compound
- Carbon : Hydrogen : Oxygen = 1 : 2 : 1 (e.g., Glucose)
This ratio shows that for every atom of carbon and oxygen, there are two atoms of hydrogen. If a scientist needs to synthesize 1 mole of glucose (C6H12O6), they must ensure the elements are combined in the correct ratio:
- Carbon = 6 moles
- Hydrogen = 12 moles
- Oxygen = 6 moles
Adhering to this ratio is crucial for the accurate synthesis of the compound and the success of the experiment.
2.4. Resource Allocation
Governments, organizations, and businesses use extended ratios to allocate resources effectively. This could involve distributing funds across different departments, allocating staff to various projects, or managing inventory.
Example: Budget Allocation
- Marketing : Sales : Operations = 2 : 3 : 5
This ratio indicates how a company allocates its budget across three key departments. For every $10 of the budget, $2 is allocated to marketing, $3 to sales, and $5 to operations. If the total budget is $1,000,000, the allocation would be:
- Marketing = (2/10) * $1,000,000 = $200,000
- Sales = (3/10) * $1,000,000 = $300,000
- Operations = (5/10) * $1,000,000 = $500,000
This ensures that each department receives the necessary funding to achieve its objectives while maintaining a balanced and efficient organizational structure.
2.5. Healthcare
In healthcare, ratios are used to administer medications, manage patient care, and allocate resources. For example, nurses use ratios to determine the correct dosage of medication based on a patient’s weight and condition.
Example: Medication Dosage
- Drug : Saline Solution = 1 : 100
This ratio indicates that for every 1 part of the drug, there are 100 parts of saline solution. If a patient requires 0.5 mg of the drug, the solution would be:
- Drug = 0.5 mg
- Saline Solution = 0.5 mg * 100 = 50 mg
This precise measurement is critical for patient safety and the effectiveness of the treatment.
2.6. Real Estate and Construction
In real estate and construction, ratios are used to determine the proportions of materials, allocate space in a building, and manage costs. For example, an architect might use a ratio to determine the proportions of different types of rooms in a house.
Example: Room Allocation
- Bedrooms : Living Areas : Utility Spaces = 3 : 2 : 1
This ratio indicates the proportion of space allocated to different types of rooms. For every 6 units of space, 3 units are for bedrooms, 2 units for living areas, and 1 unit for utility spaces. If the total area of the house is 1800 square feet, the allocation would be:
- Bedrooms = (3/6) * 1800 sq ft = 900 sq ft
- Living Areas = (2/6) * 1800 sq ft = 600 sq ft
- Utility Spaces = (1/6) * 1800 sq ft = 300 sq ft
This ensures a balanced and functional design that meets the needs of the occupants.
3. Methods for Comparing Ratios with Three or More Numbers
Comparing ratios involving three or more numbers requires systematic methods to ensure accuracy and clarity. These methods help in understanding the proportional relationships between different quantities, making it easier to make informed decisions. Here are the primary methods for comparing these types of ratios:
3.1. Finding a Common Multiple
One of the most effective ways to compare ratios is to find a common multiple for one of the terms. This method is particularly useful when you want to compare the other terms relative to a specific quantity.
Steps:
- Identify the Term to Equalize: Choose a term that appears in all ratios and that you want to use as a reference point.
- Find the Least Common Multiple (LCM): Determine the LCM of the chosen term across all ratios.
- Adjust the Ratios: Multiply each ratio by a factor that makes the chosen term equal to the LCM.
- Compare the Ratios: Once the chosen terms are equal, you can directly compare the other terms in the ratios.
Example:
Compare the following ratios:
- A : B : C = 2 : 3 : 4
- D : E : F = 1 : 2 : 3
- G : H : I = 3 : 4 : 5
To compare these ratios, equalize the first term:
-
The terms to equalize are 2, 1, and 3.
-
The LCM of 2, 1, and 3 is 6.
-
Adjust the ratios:
- A : B : C = (2 3) : (3 3) : (4 * 3) = 6 : 9 : 12
- D : E : F = (1 6) : (2 6) : (3 * 6) = 6 : 12 : 18
- G : H : I = (3 2) : (4 2) : (5 * 2) = 6 : 8 : 10
-
Now the ratios are:
- A : B : C = 6 : 9 : 12
- D : E : F = 6 : 12 : 18
- G : H : I = 6 : 8 : 10
You can now easily compare the ratios based on the values of B, C, E, F, H, and I.
3.2. Converting to Percentages
Converting ratios to percentages is another effective method for comparison, especially when dealing with different totals. This approach normalizes the ratios, allowing for a straightforward comparison.
Steps:
- Calculate the Total for Each Ratio: Add all the terms in each ratio to find the total.
- Divide Each Term by the Total: Divide each term in the ratio by the total to find its proportional value.
- Convert to Percentages: Multiply each proportional value by 100 to express it as a percentage.
- Compare the Percentages: Compare the percentages to understand the relative proportions.
Example:
Convert the following ratios to percentages:
- X : Y : Z = 1 : 2 : 3
- P : Q : R = 2 : 3 : 5
-
Calculate the totals:
- Total for X : Y : Z = 1 + 2 + 3 = 6
- Total for P : Q : R = 2 + 3 + 5 = 10
-
Divide each term by the total:
- X = 1/6, Y = 2/6, Z = 3/6
- P = 2/10, Q = 3/10, R = 5/10
-
Convert to percentages:
- X = (1/6) * 100 = 16.67%
- Y = (2/6) * 100 = 33.33%
- Z = (3/6) * 100 = 50%
- P = (2/10) * 100 = 20%
- Q = (3/10) * 100 = 30%
- R = (5/10) * 100 = 50%
-
Now the ratios are:
- X : Y : Z = 16.67% : 33.33% : 50%
- P : Q : R = 20% : 30% : 50%
You can now easily compare the percentage contributions of each term in the ratios.
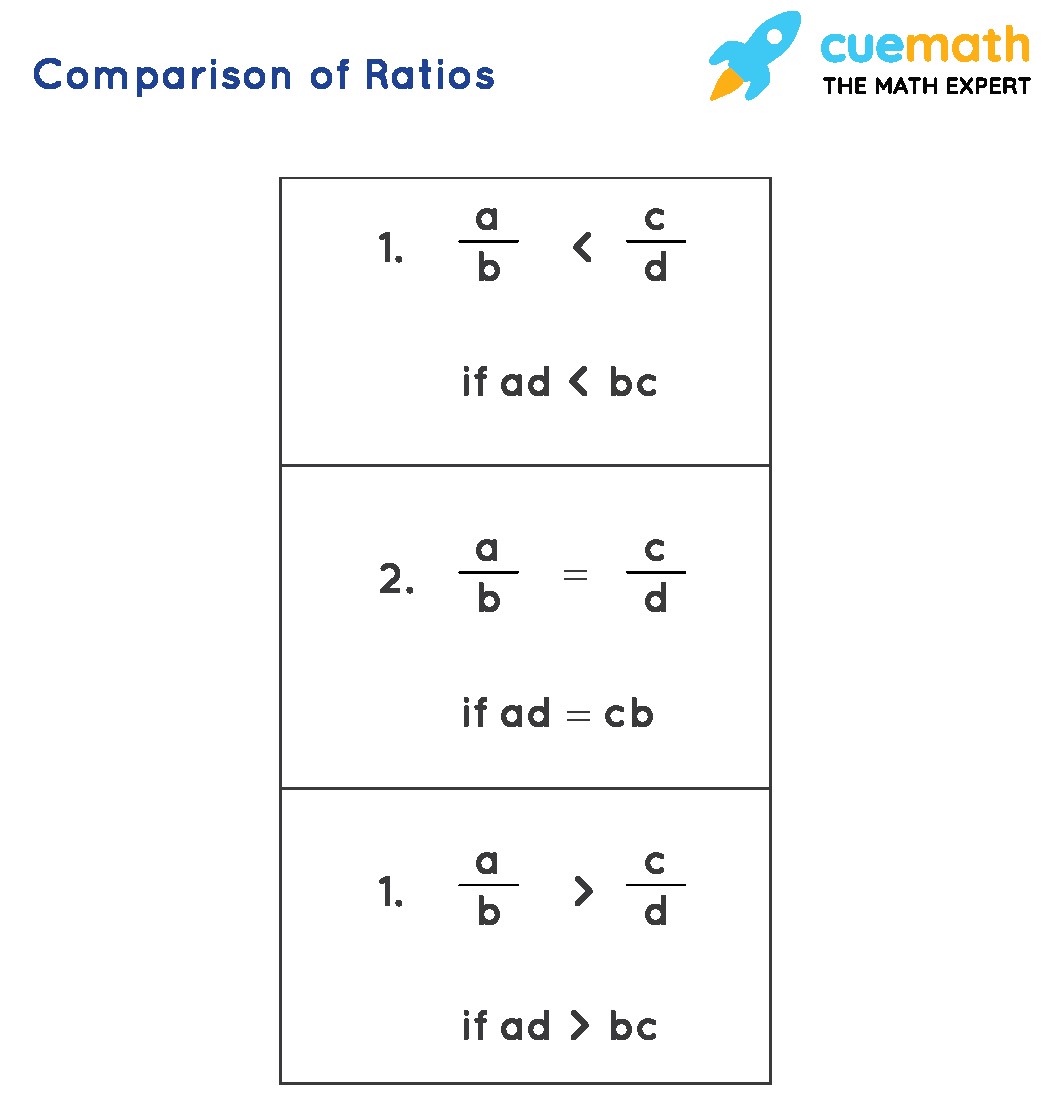
3.3. Using a Common Denominator (Fractional Method)
This method involves expressing the ratios as fractions with a common denominator, making it easier to compare the numerators.
Steps:
- Express Ratios as Fractions: Write each term in the ratio as a fraction of the total.
- Find the Least Common Denominator (LCD): Determine the LCD of all the fractions.
- Convert Fractions to Equivalent Fractions: Convert each fraction to an equivalent fraction with the LCD as the denominator.
- Compare the Numerators: Compare the numerators of the fractions to understand the relative proportions.
Example:
Compare the following ratios:
- L : M : N = 3 : 4 : 5
- S : T : U = 1 : 2 : 3
-
Express ratios as fractions:
- L = 3/(3+4+5) = 3/12, M = 4/12, N = 5/12
- S = 1/(1+2+3) = 1/6, T = 2/6, U = 3/6
-
Find the LCD:
- The denominators are 12 and 6. The LCD is 12.
-
Convert fractions to equivalent fractions:
- L = 3/12, M = 4/12, N = 5/12
- S = (1/6) (2/2) = 2/12, T = (2/6) (2/2) = 4/12, U = (3/6) * (2/2) = 6/12
-
Now the fractions are:
- L = 3/12, M = 4/12, N = 5/12
- S = 2/12, T = 4/12, U = 6/12
You can now easily compare the numerators to understand the relative proportions.
3.4. Normalization
Normalization involves scaling the ratios so that their totals are equal to 1 (or 100%). This method is useful when comparing ratios with different scales.
Steps:
- Calculate the Total for Each Ratio: Add all the terms in each ratio to find the total.
- Divide Each Term by the Total: Divide each term in the ratio by the total to normalize it.
- Compare the Normalized Values: Compare the normalized values to understand the relative proportions.
Example:
Normalize the following ratios:
- A : B : C = 5 : 10 : 15
- D : E : F = 2 : 3 : 5
-
Calculate the totals:
- Total for A : B : C = 5 + 10 + 15 = 30
- Total for D : E : F = 2 + 3 + 5 = 10
-
Divide each term by the total:
- A = 5/30 = 1/6, B = 10/30 = 1/3, C = 15/30 = 1/2
- D = 2/10 = 1/5, E = 3/10, F = 5/10 = 1/2
-
Now the normalized values are:
- A : B : C = 1/6 : 1/3 : 1/2
- D : E : F = 1/5 : 3/10 : 1/2
You can now easily compare the normalized values to understand the relative proportions.
4. Common Mistakes When Comparing Ratios With Three or More Numbers
Comparing ratios with three or more numbers can be tricky, and it’s easy to make mistakes if you’re not careful. Here are some common pitfalls to avoid:
4.1. Ignoring Units
One of the most fundamental mistakes is failing to ensure that all quantities in the ratio are measured in the same units. Comparing values with different units can lead to nonsensical results.
Example:
Suppose you’re comparing the ratio of time spent on three tasks:
- Task A: 30 minutes
- Task B: 1 hour
- Task C: 45 minutes
If you directly use the numbers without converting to a common unit (e.g., minutes), you’ll get a ratio of 30:1:45, which is misleading. The correct approach is to convert all times to minutes, resulting in a ratio of 30:60:45, which can then be simplified to 2:4:3.
4.2. Incorrectly Simplifying Ratios
Simplifying ratios is essential for making comparisons easier, but it must be done correctly. A common mistake is dividing only some terms by a common factor, rather than all of them.
Example:
Consider the ratio 4:8:12. If you only divide the first two terms by 4, you might incorrectly simplify it to 1:2:12. The correct simplification involves dividing all terms by their greatest common divisor (GCD), which is 4 in this case, resulting in the simplified ratio 1:2:3.
4.3. Misinterpreting Part-to-Part vs. Part-to-Whole Ratios
It’s crucial to distinguish between part-to-part and part-to-whole ratios. Mixing them up can lead to incorrect conclusions.
Example:
In a team of 10 people, the ratio of developers to testers to managers is 5:3:2. A part-to-part ratio compares developers to testers (5:3) or testers to managers (3:2). A part-to-whole ratio compares developers to the total team (5:10 or 1:2). Misinterpreting these ratios can lead to incorrect resource allocation or project planning.
4.4. Comparing Ratios Without a Common Base
Comparing ratios directly without a common base (e.g., total, LCM) can be misleading. This is especially true when the ratios represent different totals.
Example:
Consider two classrooms:
- Class A: Boys to Girls to Teachers = 10:15:1 (Total = 26)
- Class B: Boys to Girls to Teachers = 8:12:1 (Total = 21)
Directly comparing the numbers might suggest that Class A has more boys and girls, but this doesn’t account for the different class sizes. To make a fair comparison, you need to normalize the ratios or find a common multiple.
4.5. Overlooking the Importance of Order
The order of terms in a ratio is critical. Changing the order changes the relationship being expressed.
Example:
The ratio of apples to oranges to bananas is 3:2:1. This is very different from a ratio of 1:2:3, where the quantities are reversed. Always ensure that the terms are in the correct order to accurately represent the intended comparison.
4.6. Not Simplifying Before Comparing
Failing to simplify ratios before comparing them can make the comparison more difficult and increase the chances of error.
Example:
Comparing the ratios 12:18:24 and 15:20:25 directly can be challenging. However, if you simplify them first, you get 2:3:4 and 3:4:5, respectively, making the comparison much easier.
4.7. Using Ratios When Absolute Numbers Are Needed
Ratios provide proportional relationships, but they don’t give absolute numbers. Relying solely on ratios without considering the actual quantities can lead to poor decisions.
Example:
A company allocates its budget in the ratio of 2:3:5 for marketing, sales, and operations, respectively. While this gives a sense of proportion, it doesn’t tell you the actual amounts allocated to each department. If the total budget is small, even a large proportion might translate to insufficient funds.
4.8. Ignoring Context
Failing to consider the context in which the ratios are being used can lead to misinterpretations.
Example:
A recipe calls for flour, sugar, and butter in the ratio of 3:2:1. This ratio might work perfectly for a standard cake, but it might need adjustment for a different type of cake or a different baking method. Always consider the specific requirements of the situation.
4.9. Assuming Ratios Are Additive
Ratios cannot be added directly unless they have the same base. Adding ratios with different bases can lead to incorrect results.
Example:
If you have two ratios, A:B:C = 1:2:3 and D:E:F = 2:3:4, you cannot simply add the corresponding terms to get a new ratio. Instead, you need to find a common base or use another method to compare them properly.
4.10. Neglecting to Double-Check Calculations
Even with a clear understanding of the concepts, it’s easy to make arithmetic errors. Always double-check your calculations to ensure accuracy.
Example:
When converting ratios to percentages, a simple mistake in division or multiplication can lead to significant errors. Always verify your calculations to avoid misleading results.
5. Benefits of Using Ratios to Compare Three or More Numbers
Using ratios to compare three or more numbers offers several distinct advantages, making it a valuable tool in various fields. Here are some of the key benefits:
5.1. Simplified Comparison
Ratios transform complex data into a simplified format, making it easier to compare multiple quantities at once. By expressing the proportional relationship between different elements, ratios allow for a clear and concise comparison that is easy to understand.
Example:
Consider comparing the distribution of expenses across three departments in a company:
- Department A: $50,000
- Department B: $75,000
- Department C: $125,000
Converting these expenses into a ratio (2:3:5) simplifies the comparison, allowing stakeholders to quickly grasp the relative spending across departments.
5.2. Proportional Insight
Ratios provide insight into the proportional distribution of quantities, which is essential for understanding how different parts contribute to a whole. This is particularly useful in resource allocation, budgeting, and financial analysis.
Example:
In a project team, the ratio of developers to testers to project managers is 5:3:2. This ratio highlights the proportional allocation of roles within the team, helping to ensure that resources are appropriately distributed to meet project needs.
5.3. Consistent Analysis
Ratios offer a consistent method for analysis, allowing for standardized comparisons across different datasets and scenarios. This consistency is vital for tracking trends, identifying patterns, and making informed decisions.
Example:
A retail company uses ratios to analyze sales across different product categories:
- Category X: 30%
- Category Y: 45%
- Category Z: 25%
By consistently tracking these ratios over time, the company can identify shifts in consumer preferences, adjust inventory levels, and optimize marketing strategies.
5.4. Scalability
Ratios are scalable, meaning they can be applied to datasets of varying sizes without losing their effectiveness. Whether you’re comparing small quantities or large numbers, ratios provide a proportional representation that remains meaningful.
Example:
A restaurant uses a ratio of 3:2:1 for flour, sugar, and butter in its cake recipe. This ratio can be scaled up or down to accommodate different batch sizes, ensuring that the cake maintains its desired consistency and flavor, regardless of the quantity being prepared.
5.5. Decision Making
Ratios support informed decision-making by providing a clear and objective basis for comparison. By highlighting the relative importance of different factors, ratios help decision-makers prioritize resources, allocate budgets, and optimize strategies.
Example:
A marketing team uses ratios to evaluate the effectiveness of different advertising channels:
- Channel A: 40% conversion rate
- Channel B: 30% conversion rate
- Channel C: 20% conversion rate
Based on these ratios, the team can allocate more resources to Channel A, which has the highest conversion rate, to maximize the return on investment.
5.6. Benchmarking
Ratios facilitate benchmarking by providing a standardized metric for comparing performance against industry standards or best practices. This allows organizations to identify areas for improvement, set realistic goals, and track progress over time.
Example:
A manufacturing company uses ratios to compare its production efficiency against industry benchmarks:
- Company X: 90% efficiency
- Industry Benchmark: 95% efficiency
By comparing its efficiency ratio to the industry benchmark, the company can identify areas for improvement, such as streamlining processes, investing in new equipment, or providing additional training to employees.
5.7. Communication
Ratios are easy to communicate and understand, making them an effective tool for conveying complex information to a wide audience. Whether you’re presenting data to stakeholders, explaining concepts to students, or sharing insights with colleagues, ratios provide a clear and concise way to communicate proportional relationships.
Example:
A non-profit organization uses ratios to communicate how donations are allocated across different programs:
- Program A: 50%
- Program B: 30%
- Program C: 20%
This simple ratio helps donors understand how their contributions are being used, fostering trust and encouraging further support.
5.8. Problem Solving
Ratios are valuable for problem-solving by providing a structured approach to analyzing and addressing complex issues. By breaking down problems into proportional relationships, ratios help identify root causes, evaluate potential solutions, and implement effective strategies.
Example:
A hospital uses ratios to analyze patient wait times:
- Emergency Room: 60%
- Outpatient Clinic: 30%
- Specialty Care: 10%
By analyzing these ratios, the hospital can identify bottlenecks in the patient flow process, allocate resources more effectively, and implement strategies to reduce wait times and improve patient satisfaction.
5.9. Trend Analysis
Ratios are useful for trend analysis by providing a historical perspective on proportional relationships. By tracking how ratios change over time, organizations can identify emerging trends, anticipate future challenges, and adapt their strategies accordingly.
Example:
An e-commerce company uses ratios to analyze customer acquisition costs across different marketing channels:
- Year 1: 40% search engine marketing, 30% social media, 20% email marketing
- Year 5: 20% search engine marketing, 50% social media, 10% email marketing
By tracking these ratios over time, the company can see that social media has become a more effective channel for customer acquisition, and adjust its marketing budget accordingly.
5.10. Flexibility
Ratios are flexible and can be applied to a wide range of scenarios, making them a versatile tool for analysis and decision-making. Whether you’re comparing financial data, operational metrics, or scientific measurements, ratios provide a standardized approach that can be adapted to suit different contexts and objectives.
Example:
A construction company uses ratios to manage project costs:
- Materials: 40%
- Labor: 30%
- Subcontractors: 20%
- Overhead: 10%
This flexible framework allows the company to monitor project expenses, identify cost overruns, and implement corrective actions to ensure projects are completed on time and within budget.
6. Examples of Real-World Ratios Comparing Multiple Numbers
Ratios comparing multiple numbers are prevalent in various real-world scenarios, offering insights and aiding in decision-making. Understanding these examples can illustrate the practical application of ratios in different fields.
6.1. Dietary Ratios
In nutrition, dietary ratios are used to balance macronutrient intake. For example, a common macronutrient ratio for a balanced diet is:
- Protein : Carbohydrates : Fats = 30% : 40% : 30%
This ratio helps individuals plan their meals to ensure they are getting the right proportions of each macronutrient for optimal health and energy levels.
Application:
A person consuming 2000 calories per day would aim for:
- Protein: 2000 * 0.30 = 600 calories (150 grams, since 1 gram of protein is 4 calories)
- Carbohydrates: 2000 * 0.40 = 800 calories (200 grams, since 1 gram of carbohydrate is 4 calories)
- Fats: 2000 * 0.30 = 600 calories (67 grams, since 1 gram of fat is 9 calories)
6.2. Concrete Mixing Ratios
In construction, the mixing ratio of concrete is crucial for ensuring the strength and durability of structures. A typical concrete mix ratio is:
- Cement : Sand : Aggregate = 1 : 2 : 4
This ratio ensures that the concrete has the right balance of binding material (cement), fine aggregate (sand), and coarse aggregate (gravel) to achieve the desired strength.
Application:
For a small project requiring 7 cubic feet of concrete:
- Cement: 1 part = 1/7 * 7 cubic feet = 1 cubic foot
- Sand: 2 parts = 2/7 * 7 cubic feet = 2 cubic feet
- Aggregate: 4 parts = 4/7 * 7 cubic feet = 4 cubic feet
6.3. Paint Mixing Ratios
In art and painting, ratios are used to mix custom colors. For example, to achieve a specific shade of green, an artist might use the following ratio:
- Blue : Yellow : White = 2 : 3 : 1
This ratio helps artists consistently recreate the desired color by maintaining the correct proportions of each pigment.
Application:
If an artist needs 6 ounces of the custom green:
- Blue: 2 parts = 2/6 * 6 ounces = 2 ounces
- Yellow: 3 parts = 3/6 * 6 ounces = 3 ounces
- White: 1 part = 1/6 * 6 ounces = 1 ounce
6.4. Business Financial Ratios
In finance, businesses use ratios to assess their financial health and performance. A common set of financial ratios includes:
- Liquidity : Profitability : Solvency = 20% : 30% : 50%
These ratios provide insights into a company’s ability to meet short-term obligations (liquidity), generate profits (profitability), and manage long-term debt (solvency).
Application:
For a company with total assets of $1,000,000:
- Liquidity (Current Assets): $1,000,000 * 0.20 = $200,000
- Profitability (Retained Earnings): $1,000,000 * 0.30 = $300,000
- Solvency (Equity): $1,000,000 * 0.50 = $500,000
6.5. Staffing Ratios in Healthcare
In healthcare, staffing ratios are used to ensure adequate patient care. For example, a nursing home might have the following staffing ratio:
- Registered Nurses : Licensed Practical Nurses : Certified Nursing Assistants = 1 : 2 : 5
This ratio ensures that there are enough qualified staff members to provide the necessary care for the residents.
Application:
For a nursing home with 80 residents:
- Registered Nurses: 1 part = 1/8 * Total Staff = 10 staff members
- Licensed Practical Nurses: 2 parts = 2/8 * Total Staff = 20 staff members
- Certified Nursing Assistants: 5 parts = 5/8 * Total Staff = 50 staff members
6.6. Academic Grading Ratios
In education, grading ratios are used to weight different components of a student’s grade. For example:
- Homework : Quizzes : Exams = 20% : 30% : 50%
This ratio ensures that each component contributes fairly to the final grade.
Application:
A student’s performance in each category:
- Homework: 85/100
- Quizzes: 90/100
- Exams: 80/100
The final grade is calculated as:
- Final Grade = (0.20 85) + (0.30 90) + (0.50 * 80) = 17 + 27 + 40 = 84/100
6.7. Environmental Monitoring Ratios
In environmental science, ratios are used to assess the quality of air or water. For example, the ratio of certain pollutants in the air:
- Nitrogen Dioxide : Sulfur Dioxide : Particulate Matter = 1 : 2 : 3
This ratio helps scientists understand the relative levels of different pollutants and take appropriate action to improve air quality.
Application:
In a sample of air:
- Nitrogen Dioxide: 1 part = 1/6 * Total Pollutants
- Sulfur Dioxide: 2 parts = 2/6 * Total Pollutants
- Particulate Matter: 3 parts = 3/6 * Total Pollutants
6.8. Marketing Budget Allocation Ratios
In marketing, ratios are used to allocate budgets across different channels:
- Digital Marketing : Print Advertising : Public Relations = 50% : 30% : 20%
This ratio helps marketers distribute their budget effectively to reach their target audience and achieve their marketing goals.
Application:
For a marketing budget of $100,000:
- Digital Marketing: $100,000 * 0.50 = $50,000
- Print Advertising: $100,000 * 0.30 = $30,000
- Public Relations: $100,000 * 0.20 = $20,0
