Comparing data is crucial for various analyses, but what happens when the sample sizes differ? COMPARE.EDU.VN explains when this is possible and what statistical methods to use. Learn how to compare data with unequal sample sizes for accurate analysis.
1. Understanding the Importance of Data Comparison
Data comparison is a cornerstone of informed decision-making in numerous fields, from academic research to business analytics. The ability to draw meaningful conclusions from data hinges on effective comparison techniques. This process involves identifying similarities and differences between datasets, understanding the patterns they reveal, and using these insights to guide strategic decisions. Consider the realm of scientific research, where comparing experimental results against control groups is essential for validating hypotheses and advancing knowledge. Or in the business world, comparing sales data across different periods can reveal trends, inform marketing strategies, and improve overall performance. The objective comparison of data enables evidence-based strategies, improved decision-making, and a deeper understanding of the factors influencing results. COMPARE.EDU.VN provides the tools you need to conduct in-depth data analysis.
2. Key Considerations When Comparing Data
When delving into data comparison, several critical aspects must be taken into account to ensure the accuracy and validity of your conclusions. These considerations act as safeguards against drawing misleading or biased interpretations. Sample size is a primary factor; datasets with significantly different sample sizes may require different statistical approaches to achieve a fair comparison. Data distribution also plays a crucial role, as some statistical tests are more appropriate for normally distributed data than for non-normal distributions. Understanding the type of data you’re working with, whether continuous or categorical, is also essential, as it influences the choice of comparison methods. By carefully considering these aspects, you can ensure that your data comparisons are robust, meaningful, and lead to reliable insights.
3. The Challenge of Different Sample Sizes
Comparing datasets with different sample sizes presents a unique set of challenges. A larger sample size generally provides a more accurate representation of the population, making it easier to detect statistically significant differences. Conversely, smaller sample sizes may lack the statistical power to identify genuine differences, leading to false negatives. This disparity in statistical power can complicate the comparison process and potentially skew the results. For instance, imagine comparing the effectiveness of two marketing campaigns, one of which was tested on a large audience, while the other was tested on a smaller group. Simply comparing the raw conversion rates may be misleading due to the differences in sample size and statistical power. Effective data comparison requires careful consideration of these challenges and the implementation of appropriate statistical techniques to mitigate their impact.
4. Statistical Methods for Comparing Data with Different Sample Sizes
Fortunately, several statistical methods are available to address the challenges posed by comparing data with different sample sizes. These methods are designed to account for the variations in statistical power and provide a more accurate comparison.
4.1. T-tests
The t-test is a widely used statistical test for determining if there is a significant difference between the means of two groups. There are several types of t-tests, including the independent samples t-test (for comparing the means of two independent groups) and the paired samples t-test (for comparing the means of two related groups). When comparing data with different sample sizes, the independent samples t-test is often used.
To perform a t-test, your data needs to be continuous and follow the normal distribution (data are distributed evenly about the mean). Plus, the variance of the two sets of data needs to be the same. Why not brush up on your statistical terms if you’re a little rusty? The t-test comes in both paired and unpaired varieties. In general, most data in biology tends to be unpaired.
If you’re not 100% sure whether your data is paired, err on the side of caution and assume it isn’t (and read the article on statistical terms I just plugged). You can use an unpaired t-test on paired data without negative consequences. However, if you use a paired t-test on unpaired data, you can get a significant result when there is actually no significance and obtain a so-called Type 1 error.
- Independent Samples T-Test: This test compares the means of two independent groups and is appropriate when the data is normally distributed and the variances are equal.
- Welch’s T-Test: An adaptation of the t-test, Welch’s t-test is used when the variances of the two groups are unequal. This test is more robust and provides a more accurate comparison when the assumption of equal variances is violated.
4.2. Analysis of Variance (ANOVA)
ANOVA is a statistical test that is used to compare the means of two or more groups. It can be used to compare data with different sample sizes, but it is important to note that ANOVA assumes that the data is normally distributed and that the variances of the groups are equal. If these assumptions are not met, then ANOVA may not be the appropriate test to use.
4.3. Non-Parametric Tests
Non-parametric tests are statistical tests that do not require the data to be normally distributed. These tests can be used to compare data with different sample sizes, and they are particularly useful when the data is not normally distributed or when the sample sizes are small.
- Mann-Whitney U Test: The Mann–Whitney U test, also called Mann–Whitney–Wilcoxon (MWW), Wilcoxon rank-sum test, or Wilcoxon–Mann–Whitney, is used for unpaired samples and is a non-parametric test (it makes no assumptions regarding the distribution or similarity of variances). The Mann–Whitney U test is performed by converting your data into ranks and analyzing the difference between the rank totals, providing a statistic, U. The lower the U, the less likely differences have occurred by chance.
- Kruskal-Wallis Test: This is a non-parametric test used to compare two or more independent samples of equal or different sample sizes. It extends the Mann-Whitney U test to situations with more than two groups.
4.4. Resampling Methods
Resampling methods involve repeatedly sampling from the original data to create multiple datasets, which are then used to estimate the variability of the statistic of interest. These methods can be particularly useful when comparing data with different sample sizes.
- Bootstrapping: Bootstrapping involves resampling from the original data with replacement to create multiple datasets. These datasets are then used to estimate the standard error of the statistic of interest, which can be used to compare the groups.
- Permutation Tests: Permutation tests involve randomly shuffling the data to create multiple datasets. These datasets are then used to calculate the p-value for the test, which can be used to determine if the difference between the groups is statistically significant.
4.5. Effect Size Measures
In addition to statistical significance, it is also important to consider the practical significance of the difference between the groups. Effect size measures provide an indication of the magnitude of the difference between the groups, which can be used to determine if the difference is meaningful in a real-world context.
- Cohen’s d: Cohen’s d is a widely used effect size measure that indicates the standardized difference between two means. It is calculated by dividing the difference between the means by the pooled standard deviation.
- Hedges’ g: Hedges’ g is a corrected version of Cohen’s d that is less biased when the sample sizes are small.
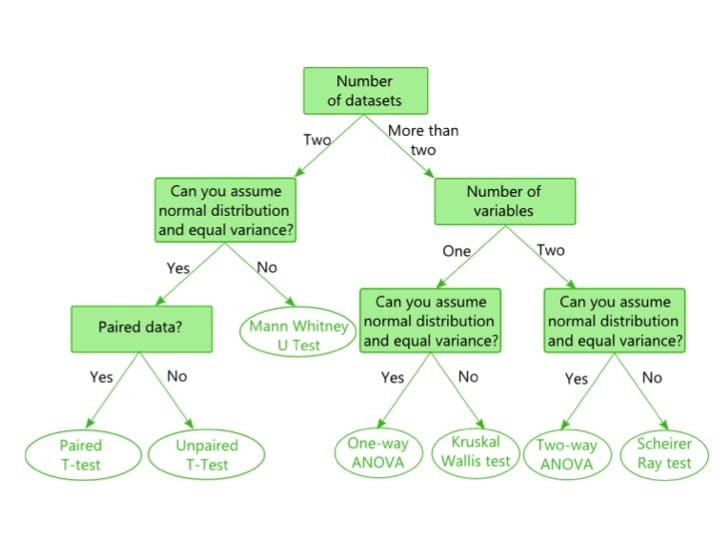 Statistical methods decision tree
4.6. Weighting Methods
Weighting methods adjust the contribution of each data point based on the sample size of its group. This can help to balance the influence of groups with smaller sample sizes, preventing them from being overshadowed by larger groups.
5. Normalization Techniques
Normalization techniques adjust the data to a common scale, allowing for more meaningful comparisons, especially when dealing with different units or ranges.
5.1. Z-Scores
Z-scores standardize the data by subtracting the mean and dividing by the standard deviation. This transforms the data into a standard normal distribution with a mean of 0 and a standard deviation of 1, allowing for comparison of data points from different distributions.
5.2. Min-Max Scaling
Min-max scaling scales the data to a range between 0 and 1 by subtracting the minimum value and dividing by the range (maximum value minus minimum value). This technique is useful when the data has different ranges and you want to compare the relative values.
6. Addressing Bias in Data Comparison
Bias can significantly skew the results of data comparison, leading to inaccurate conclusions. Identifying and mitigating bias is essential for ensuring the integrity of your analysis.
6.1. Selection Bias
Selection bias occurs when the data is not representative of the population due to the way it was selected. This can be addressed by using random sampling techniques and ensuring that the sample is representative of the population.
6.2. Confirmation Bias
Confirmation bias occurs when you tend to look for information that confirms your beliefs and ignore information that contradicts them. This can be addressed by being aware of your own biases and actively seeking out diverse perspectives.
6.3. Publication Bias
Publication bias occurs when studies with positive results are more likely to be published than studies with negative results. This can be addressed by looking for unpublished studies and considering the possibility of publication bias when interpreting the results.
7. Visualizing Data with Different Sample Sizes
Visualizing data can help to identify patterns and trends that may not be apparent from the raw data. When visualizing data with different sample sizes, it is important to choose a visualization technique that is appropriate for the data and the research question.
7.1. Bar Charts
Bar charts are a simple and effective way to compare the means of two or more groups. When using bar charts to compare data with different sample sizes, it is important to include error bars to indicate the variability of the data.
7.2. Scatter Plots
Scatter plots are a useful way to visualize the relationship between two variables. When using scatter plots to compare data with different sample sizes, it is important to adjust the size of the points to reflect the sample size.
7.3. Box Plots
Box plots are a useful way to visualize the distribution of a dataset. When using box plots to compare data with different sample sizes, it is important to be aware that the size of the box may be affected by the sample size.
8. Case Studies: Comparing Data in Real-World Scenarios
Examining real-world case studies can provide valuable insights into how to effectively compare data with different sample sizes. These examples demonstrate the application of statistical methods and normalization techniques in various contexts.
8.1. Comparing Marketing Campaign Performance
A company wants to compare the effectiveness of two marketing campaigns, one of which was tested on a large audience, while the other was tested on a smaller group. By using a t-test and effect size measures, the company can determine if there is a statistically significant and practically meaningful difference between the two campaigns.
8.2. Analyzing Clinical Trial Results
In a clinical trial, researchers want to compare the effectiveness of a new drug to a placebo. The treatment group has a larger sample size than the placebo group. By using an ANOVA and normalization techniques, the researchers can determine if the new drug is more effective than the placebo.
8.3. Comparing Website User Engagement
A website wants to compare user engagement across different devices (desktop vs. mobile). The sample sizes for each device type vary significantly. By using non-parametric tests and resampling methods, the website can determine if there is a significant difference in user engagement between the two device types.
9. Best Practices for Accurate Data Comparison
To ensure accurate and reliable data comparison, it is important to follow best practices throughout the process.
9.1. Clearly Define the Research Question
Before you begin comparing data, it is important to clearly define the research question. This will help you to choose the appropriate statistical methods and visualization techniques.
9.2. Collect High-Quality Data
The quality of the data is critical for accurate data comparison. It is important to collect high-quality data from reliable sources and to clean the data to remove any errors or inconsistencies.
9.3. Choose Appropriate Statistical Methods
The choice of statistical methods depends on the type of data, the research question, and the sample sizes. It is important to choose statistical methods that are appropriate for your data and to understand the assumptions of the methods.
9.4. Normalize Data When Necessary
Normalization techniques can help to improve the accuracy of data comparison when the data has different units or ranges. It is important to choose normalization techniques that are appropriate for your data and to understand the limitations of the techniques.
9.5. Visualize the Data
Visualizing the data can help to identify patterns and trends that may not be apparent from the raw data. It is important to choose visualization techniques that are appropriate for the data and the research question.
9.6. Interpret the Results Carefully
The results of data comparison should be interpreted carefully, taking into account the statistical significance, the effect size, and the limitations of the data and the methods.
10. Common Pitfalls to Avoid
Avoiding common pitfalls is crucial for ensuring the validity and reliability of your data comparisons.
10.1. Ignoring Sample Size Differences
Failing to account for sample size differences can lead to inaccurate conclusions. It is important to use statistical methods and normalization techniques that are appropriate for comparing data with different sample sizes.
10.2. Assuming Normality
Assuming that the data is normally distributed when it is not can lead to incorrect results. It is important to test for normality and to use non-parametric tests when the data is not normally distributed.
10.3. Over-Interpreting Statistical Significance
Statistical significance does not always imply practical significance. It is important to consider the effect size and the context of the research question when interpreting the results.
10.4. Cherry-Picking Data
Cherry-picking data is the practice of selecting data that supports your beliefs and ignoring data that contradicts them. This can lead to biased results and inaccurate conclusions. It is important to be objective and to consider all of the data when comparing data.
10.5. Failing to Address Bias
Failing to address bias can significantly skew the results of data comparison. It is important to identify and mitigate bias throughout the process.
11. The Role of Technology in Data Comparison
Technology plays a vital role in facilitating data comparison, providing tools and platforms for efficient analysis and visualization. Statistical software packages, such as R, SPSS, and SAS, offer a wide range of statistical methods for comparing data with different sample sizes. Data visualization tools, such as Tableau and Power BI, allow you to create interactive visualizations that can help you to identify patterns and trends in the data. Data analysis platforms, such as Python with libraries like Pandas and NumPy, offer flexible and powerful tools for data manipulation and analysis. The advancement of technology has made it easier than ever to compare data, generate insights, and make informed decisions.
12. Future Trends in Data Comparison
The field of data comparison is constantly evolving, with new trends and technologies emerging to enhance the process.
12.1. Artificial Intelligence (AI)
AI is being used to automate the process of data comparison, identify patterns and trends, and generate insights. Machine learning algorithms can be trained to analyze large datasets and identify relationships that may not be apparent to humans.
12.2. Big Data Analytics
Big data analytics is being used to analyze large and complex datasets, identify patterns and trends, and make predictions. Big data technologies, such as Hadoop and Spark, can be used to process and analyze large volumes of data in a timely manner.
12.3. Data Visualization
Data visualization is becoming increasingly important for communicating the results of data comparison. Interactive visualizations can help to engage audiences and to make complex data more accessible.
13. Ethical Considerations in Data Comparison
Ethical considerations are paramount in data comparison, ensuring that the process is conducted responsibly and with integrity. It is important to protect the privacy of individuals and to avoid using data in a way that could discriminate against certain groups. It is also important to be transparent about the methods used to compare data and to avoid manipulating the data to support a particular conclusion. By adhering to ethical principles, you can ensure that data comparison is used for the benefit of society.
14. Resources for Further Learning
Numerous resources are available to deepen your understanding of data comparison. Online courses, such as those offered by Coursera and edX, provide structured learning experiences. Textbooks and academic journals offer in-depth coverage of statistical methods and data analysis techniques. Professional organizations, such as the American Statistical Association, offer resources and networking opportunities for data scientists. These resources can help you to stay up-to-date on the latest trends and technologies in data comparison.
15. The COMPARE.EDU.VN Advantage
At COMPARE.EDU.VN, we understand the challenges and complexities of data comparison. Our platform is designed to provide you with the tools and resources you need to conduct accurate and meaningful comparisons, regardless of sample size differences. We offer a wide range of statistical methods, normalization techniques, and visualization tools to help you to analyze your data and generate insights. Our platform is also designed to be user-friendly and accessible, making it easy for you to compare data, even if you don’t have a background in statistics.
FAQ
1. What is the impact of unequal sample sizes on statistical power?
Unequal sample sizes can reduce statistical power, making it harder to detect significant differences. This is because the smaller sample size has less influence on the overall results.
2. Can I use a t-test with unequal sample sizes?
Yes, but Welch’s t-test is recommended when the variances are unequal. The standard independent samples t-test assumes equal variances, which may not be the case with different sample sizes.
3. Are non-parametric tests always better for unequal sample sizes?
Not always. Non-parametric tests are useful when data is not normally distributed, but they may have lower statistical power than parametric tests when data is approximately normal.
4. How does normalization help in comparing data with different sample sizes?
Normalization scales the data to a common range, making it easier to compare the relative values, regardless of the original scales or sample sizes.
5. What is Cohen’s d, and how is it useful?
Cohen’s d is an effect size measure that indicates the standardized difference between two means. It helps determine the practical significance of a difference, regardless of sample size.
6. How do resampling methods address unequal sample sizes?
Resampling methods like bootstrapping create multiple datasets from the original data, allowing for more robust estimates of variability and significance, even with unequal sample sizes.
7. What are some common biases to watch out for in data comparison?
Common biases include selection bias, confirmation bias, and publication bias. Being aware of these biases can help ensure a more objective analysis.
8. How can data visualization help with unequal sample sizes?
Visualizations like scatter plots and box plots can be adjusted to reflect sample size differences, providing a clearer representation of the data and its variability.
9. What ethical considerations should I keep in mind when comparing data?
Ethical considerations include protecting privacy, avoiding discrimination, and being transparent about methods and potential limitations.
10. Where can I find reliable statistical software for data comparison?
Reliable statistical software includes R, SPSS, SAS, and Python with libraries like Pandas and NumPy.
Conclusion
Comparing data with different sample sizes requires careful consideration of statistical methods, normalization techniques, and potential biases. By following best practices and leveraging the right tools, you can ensure accurate and meaningful comparisons that lead to informed decisions. Remember, COMPARE.EDU.VN is here to assist you in navigating these complexities and achieving your data analysis goals.
Ready to make informed decisions based on accurate data comparisons? Visit compare.edu.vn today to explore our comprehensive tools and resources. Contact us at 333 Comparison Plaza, Choice City, CA 90210, United States, or reach out via Whatsapp at +1 (626) 555-9090. Let us help you compare with confidence.