Comparing rates is crucial in various fields, from healthcare to finance, to understand the magnitude of events or occurrences relative to a population or time period. Whether you are analyzing mortality rates, investment returns, or website conversion rates, knowing How To Compare Two Rates accurately allows you to make informed decisions and draw meaningful conclusions. This article provides a comprehensive guide on comparing two rates, exploring different methods, statistical considerations, and practical examples. At COMPARE.EDU.VN, we strive to empower you with the knowledge and tools necessary to navigate these comparisons effectively.
This guide covers various aspects, including crude rates, standardized rates, rate ratios, and confidence intervals, providing you with a robust framework for rate comparison. By understanding these concepts, you can accurately assess and interpret data, leading to better insights and outcomes. Whether you’re a student, a researcher, or a professional, COMPARE.EDU.VN is here to help you make sense of the numbers.
1. Understanding Basic Rate Concepts
Before diving into the methods of comparing two rates, it’s essential to understand the fundamental concepts behind rates and their calculation.
1.1 What is a Rate?
A rate measures the frequency of an event in a defined population over a specific period. It is typically expressed as the number of events per a standard unit of population (e.g., per 1,000, per 10,000, or per 100,000) or per unit of time (e.g., per year, per month).
The formula for calculating a basic rate is:
Rate = (Number of Events / Total Population) * Multiplier
Where:
- Number of Events: The count of occurrences of the event being measured.
- Total Population: The size of the population at risk of experiencing the event.
- Multiplier: A constant used to express the rate per standard population size (e.g., 1,000, 10,000, or 100,000).
For example, if there are 50 cases of a disease in a population of 10,000 people, the rate per 1,000 would be:
Rate = (50 / 10,000) * 1,000 = 5 cases per 1,000 people
1.2 Types of Rates
There are several types of rates used in different contexts, each providing specific insights:
- Crude Rate: This is the total number of events divided by the total population. It’s simple to calculate but doesn’t account for differences in population structure.
- Specific Rate: This rate is calculated for a specific subgroup of the population, such as age-specific or gender-specific rates.
- Standardized Rate: This rate is adjusted to account for differences in population structure, allowing for more accurate comparisons between populations.
Understanding these basic types of rates is essential for selecting the appropriate method for comparison, depending on the data and the research question.
1.3 Importance of Accurate Data
The accuracy of rate comparisons heavily relies on the quality of the data used. Ensure that the data is:
- Complete: All relevant events and population counts should be included.
- Accurate: The events and population counts should be correctly recorded.
- Consistent: The data should be collected using the same methods and definitions across all groups being compared.
Inaccurate or incomplete data can lead to misleading rate comparisons and incorrect conclusions. Therefore, data validation and quality checks are crucial steps in the process.
2. Comparing Crude Rates
Crude rates are the simplest form of rate and are often the first point of comparison between two populations. However, they have limitations, particularly when the populations differ significantly in their composition.
2.1 Calculating Crude Rates
The formula for calculating a crude rate is straightforward:
Crude Rate = (Total Number of Events / Total Population) * Multiplier
For example, consider two cities:
- City A has 500 deaths in a population of 100,000.
- City B has 600 deaths in a population of 120,000.
The crude mortality rates per 1,000 would be:
- City A: (500 / 100,000) * 1,000 = 5 deaths per 1,000
- City B: (600 / 120,000) * 1,000 = 5 deaths per 1,000
In this case, the crude rates are identical, but this doesn’t necessarily mean that the underlying mortality risks are the same in both cities.
2.2 Using Rate Ratios
A rate ratio is a simple way to compare two crude rates. It is calculated by dividing one rate by the other:
Rate Ratio = Rate 1 / Rate 2
Using the example above:
Rate Ratio = 5 / 5 = 1
A rate ratio of 1 indicates that the rates are equal. A rate ratio greater than 1 indicates that Rate 1 is higher than Rate 2, and a rate ratio less than 1 indicates that Rate 1 is lower than Rate 2.
2.3 Limitations of Crude Rates
Crude rates do not account for differences in population characteristics such as age, gender, or socioeconomic status. If these characteristics differ significantly between the populations being compared, the crude rates can be misleading.
For example, if City A has a much older population than City B, the crude mortality rate in City A may be higher simply because older people are more likely to die, not because the city is less healthy. In such cases, standardized rates are necessary to provide a more accurate comparison.
Alt Text: Comparison of crude and adjusted rates showing how adjusted rates account for confounding variables like age and gender.
3. Standardized Rates: Direct Standardization
Standardized rates adjust for differences in population composition, allowing for more meaningful comparisons. Direct standardization is a common method used for this purpose.
3.1 Understanding Direct Standardization
Direct standardization involves applying the stratum-specific rates from each population to a standard population. This yields a standardized rate that represents what the rate would be if each population had the same composition as the standard population.
The formula for direct standardization is:
Standardized Rate = (Σ (Rateᵢ * Weightᵢ))
Where:
- Rateᵢ: The rate in stratum i of the study population.
- Weightᵢ: The proportion of the standard population in stratum i.
3.2 Steps for Direct Standardization
- Choose a Standard Population: Select a population that is relevant to the populations being compared. This could be one of the study populations or an external reference population.
- Calculate Stratum-Specific Rates: Determine the rates for each stratum (e.g., age group) in each study population.
- Apply Stratum-Specific Rates to the Standard Population: Multiply each stratum-specific rate by the corresponding weight (proportion) in the standard population.
- Sum the Weighted Rates: Add up the weighted rates across all strata to obtain the standardized rate.
3.3 Example of Direct Standardization
Consider two cities, City A and City B, with different age structures. We want to compare their mortality rates using direct standardization, using a standard population with a known age distribution.
| Age Group | Population of City A | Deaths in City A | Population of City B | Deaths in City B | Standard Population |
|---|---|---|---|---|---|
| 0-64 | 80,000 | 400 | 90,000 | 450 | 85,000 |
| 65+ | 20,000 | 600 | 30,000 | 900 | 25,000 |
| Total | 100,000 | 1,000 | 120,000 | 1,350 | 110,000 |
First, calculate the age-specific mortality rates per 1,000 for each city:
- City A:
- 0-64: (400 / 80,000) * 1,000 = 5 per 1,000
- 65+: (600 / 20,000) * 1,000 = 30 per 1,000
- City B:
- 0-64: (450 / 90,000) * 1,000 = 5 per 1,000
- 65+: (900 / 30,000) * 1,000 = 30 per 1,000
Next, calculate the weights (proportions) of each age group in the standard population:
- 0-64: 85,000 / 110,000 = 0.773
- 65+: 25,000 / 110,000 = 0.227
Now, apply these rates and weights to calculate the standardized rates:
- City A: (5 0.773) + (30 0.227) = 3.865 + 6.81 = 10.675 per 1,000
- City B: (5 0.773) + (30 0.227) = 3.865 + 6.81 = 10.675 per 1,000
In this example, both cities have the same standardized mortality rate (10.675 per 1,000) after adjusting for age.
3.4 Advantages and Disadvantages
Advantages:
- Removes the effect of differing population compositions.
- Allows for more accurate comparisons between populations.
Disadvantages:
- Requires detailed stratum-specific data.
- The choice of standard population can affect the standardized rates.
- Standardized rates are artificial constructs and don’t represent the actual rate in any real population.
Alt Text: Visualization of direct standardization process, illustrating how age-specific rates are applied to a standard population.
4. Standardized Rates: Indirect Standardization
Indirect standardization is another method used to adjust for differences in population composition. It is particularly useful when stratum-specific rates are not available for one or more of the study populations.
4.1 Understanding Indirect Standardization
Indirect standardization involves applying the rates from a standard population to the study populations to calculate the expected number of events. The ratio of the observed number of events to the expected number of events is known as the Standardized Mortality Ratio (SMR) or Standardized Incidence Ratio (SIR).
The formula for indirect standardization is:
SMR (or SIR) = (Observed Number of Events / Expected Number of Events)
4.2 Steps for Indirect Standardization
- Choose a Standard Population: Select a population with known stratum-specific rates.
- Apply Standard Population Rates to the Study Populations: Multiply each stratum size in the study population by the corresponding rate in the standard population to calculate the expected number of events for each stratum.
- Sum the Expected Events: Add up the expected number of events across all strata to obtain the total expected number of events for each study population.
- Calculate the SMR (or SIR): Divide the observed number of events by the expected number of events.
4.3 Example of Indirect Standardization
Consider a factory with a workforce that differs in age from the general population. We want to compare the factory’s injury rate to the general population’s injury rate using indirect standardization.
| Age Group | Factory Workers | Injury Rate in General Population (per 1,000) |
|---|---|---|
| 18-34 | 500 | 10 |
| 35-54 | 300 | 15 |
| 55+ | 200 | 20 |
| Total | 1,000 |
Observed number of injuries in the factory = 20
First, calculate the expected number of injuries for each age group in the factory using the injury rates from the general population:
- 18-34: (500 / 1,000) * 10 = 5
- 35-54: (300 / 1,000) * 15 = 4.5
- 55+: (200 / 1,000) * 20 = 4
Next, sum the expected number of injuries:
Total Expected Injuries = 5 + 4.5 + 4 = 13.5
Now, calculate the SMR:
SMR = 20 / 13.5 = 1.48
An SMR of 1.48 indicates that the factory has 48% more injuries than expected, given the age distribution of its workforce and the injury rates in the general population.
4.4 Advantages and Disadvantages
Advantages:
- Useful when stratum-specific rates are not available for the study populations.
- Provides a relative measure of risk (SMR or SIR).
Disadvantages:
- Affected by the choice of standard population.
- Can mask differences in stratum-specific rates.
- Less intuitive than direct standardization.
Alt Text: Diagram illustrating indirect standardization, showing how standard rates are applied to the study population.
5. Rate Ratios and Rate Differences
In addition to standardized rates, rate ratios and rate differences are useful measures for comparing two rates.
5.1 Calculating Rate Ratios
A rate ratio is calculated by dividing one rate by the other. It indicates how many times greater or smaller one rate is compared to the other.
Rate Ratio = Rate 1 / Rate 2
For example, if the standardized mortality rate in City A is 10 per 1,000 and in City B is 5 per 1,000:
Rate Ratio = 10 / 5 = 2
This indicates that the mortality rate in City A is twice as high as in City B.
5.2 Calculating Rate Differences
A rate difference is calculated by subtracting one rate from the other. It indicates the absolute difference in rates between two populations.
Rate Difference = Rate 1 – Rate 2
Using the same example:
Rate Difference = 10 – 5 = 5 per 1,000
This indicates that the mortality rate in City A is 5 per 1,000 higher than in City B.
5.3 Interpretation of Rate Ratios and Rate Differences
-
Rate Ratio:
- = 1: The rates are equal.
-
1: Rate 1 is higher than Rate 2.
- < 1: Rate 1 is lower than Rate 2.
-
Rate Difference:
- = 0: The rates are equal.
-
0: Rate 1 is higher than Rate 2.
- < 0: Rate 1 is lower than Rate 2.
The choice between using a rate ratio or a rate difference depends on the context and the research question. Rate ratios are useful for indicating relative differences, while rate differences are useful for indicating absolute differences.
6. Confidence Intervals for Rate Comparisons
When comparing rates, it is important to consider the uncertainty associated with the estimates. Confidence intervals provide a range within which the true rate is likely to fall.
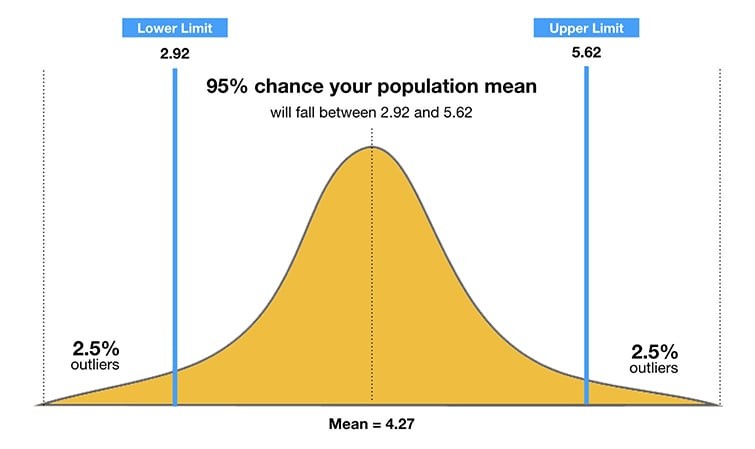
6.1 Understanding Confidence Intervals
A confidence interval (CI) is a range of values that is likely to contain the true population parameter with a certain level of confidence (e.g., 95%). The width of the confidence interval reflects the precision of the estimate. Narrower intervals indicate more precise estimates.
6.2 Calculating Confidence Intervals for Rates
The method for calculating confidence intervals depends on the distribution of the data. For rates based on count data (e.g., number of events), the Poisson distribution is often used.
The formula for calculating the confidence interval for a Poisson rate is:
CI = (Y / T) ± z * √(Y / T²)
Where:
- Y: The number of events.
- T: The person-time at risk.
- z: The z-score corresponding to the desired level of confidence (e.g., 1.96 for 95% confidence).
6.3 Comparing Rates Using Confidence Intervals
When comparing two rates, if their confidence intervals do not overlap, this suggests that the rates are significantly different. If the confidence intervals do overlap, this does not necessarily mean that the rates are not different, but it indicates that the difference is not statistically significant at the chosen level of confidence.
For example, consider two cities with the following mortality rates and 95% confidence intervals:
- City A: 10 per 1,000 (CI: 8 to 12)
- City B: 5 per 1,000 (CI: 4 to 6)
Since the confidence intervals do not overlap, we can conclude that the mortality rate in City A is significantly higher than in City B at the 95% confidence level.
6.4 Importance of Confidence Intervals
Confidence intervals provide valuable information about the precision and reliability of rate comparisons. They help to avoid over-interpreting small differences in rates that may be due to chance.
 Confidence intervals example
Alt Text: Visual representation of confidence intervals, showing the range within which the true population parameter is likely to fall.
7. Statistical Significance Tests
Statistical significance tests are used to determine whether the difference between two rates is likely to be due to chance or represents a real difference.
7.1 Choosing the Appropriate Test
The choice of statistical test depends on the type of data and the research question. For comparing two rates based on count data, the Chi-square test or Fisher’s exact test are commonly used.
- Chi-square Test: This test is used to compare the observed frequencies with the expected frequencies under the null hypothesis of no difference between the rates.
- Fisher’s Exact Test: This test is used when the sample sizes are small or when the expected frequencies are low.
7.2 Performing a Chi-Square Test
The Chi-square test involves calculating a test statistic and comparing it to a critical value from the Chi-square distribution.
-
Set up a Contingency Table: Organize the data into a table showing the observed frequencies for each group.
-
Calculate Expected Frequencies: Calculate the expected frequencies under the null hypothesis of no difference between the rates.
-
Calculate the Chi-square Statistic: Use the formula:
χ² = Σ ((Observed – Expected)² / Expected)
-
Determine the Degrees of Freedom: The degrees of freedom (df) for a 2×2 contingency table is (rows – 1) * (columns – 1).
-
Compare to Critical Value: Compare the calculated Chi-square statistic to the critical value from the Chi-square distribution with the appropriate degrees of freedom and significance level (e.g., α = 0.05).
If the calculated Chi-square statistic is greater than the critical value, the null hypothesis is rejected, indicating that the difference between the rates is statistically significant.
7.3 Interpreting Test Results
The p-value associated with the test statistic indicates the probability of observing the data (or more extreme data) if the null hypothesis is true. A small p-value (e.g., p < 0.05) indicates strong evidence against the null hypothesis, suggesting that the difference between the rates is statistically significant.
7.4 Cautions When Using Statistical Tests
- Statistical significance does not necessarily imply practical significance. A small difference in rates may be statistically significant with large sample sizes but may not be meaningful in a real-world context.
- Statistical tests are based on assumptions about the data. It is important to check that these assumptions are met before interpreting the test results.
8. Practical Considerations and Potential Biases
When comparing rates, it is important to be aware of potential biases and to take steps to minimize their impact.
8.1 Selection Bias
Selection bias occurs when the groups being compared are not representative of the populations they are intended to represent. This can lead to misleading rate comparisons.
To minimize selection bias, ensure that the groups being compared are randomly selected or that they are comparable in terms of relevant characteristics.
8.2 Information Bias
Information bias occurs when there are systematic errors in the way data is collected or measured. This can lead to inaccurate rate calculations.
To minimize information bias, use standardized data collection methods, train data collectors, and validate data sources.
8.3 Confounding
Confounding occurs when a third variable is associated with both the exposure and the outcome, leading to a spurious association between the exposure and the outcome.
To control for confounding, use stratified analysis, standardization, or multivariable regression techniques.
8.4 Ecological Fallacy
The ecological fallacy occurs when inferences about individuals are based on aggregate data. This can lead to incorrect conclusions about the relationship between exposure and outcome at the individual level.
To avoid the ecological fallacy, use individual-level data whenever possible and be cautious when interpreting aggregate data.
8.5 Importance of Context
When comparing rates, it is important to consider the context in which the rates are being compared. Factors such as socioeconomic status, access to healthcare, and environmental conditions can all influence rates.
By considering these factors, you can gain a more complete understanding of the differences between rates and avoid drawing simplistic conclusions.
9. Real-World Examples of Rate Comparisons
To illustrate the practical application of rate comparisons, consider the following real-world examples.
9.1 Comparing Hospital Readmission Rates
Hospitals often compare their readmission rates (the rate at which patients are readmitted to the hospital within a certain period, such as 30 days) to identify areas for improvement in patient care.
By comparing their readmission rates to those of other hospitals, hospitals can identify best practices and implement strategies to reduce readmissions.
9.2 Comparing Website Conversion Rates
Businesses often compare their website conversion rates (the rate at which website visitors complete a desired action, such as making a purchase) to identify areas for improvement in website design and marketing.
By comparing their conversion rates to those of competitors, businesses can identify opportunities to optimize their websites and increase sales.
9.3 Comparing Crime Rates
Cities often compare their crime rates (the rate at which crimes are reported per 1,000 residents) to assess the effectiveness of crime prevention strategies.
By comparing their crime rates to those of other cities, cities can identify effective strategies and implement them to reduce crime.
9.4 Comparing Vaccination Rates
Public health agencies often compare vaccination rates (the rate at which individuals are vaccinated against a particular disease) to assess the effectiveness of vaccination programs.
By comparing their vaccination rates to those of other regions, public health agencies can identify areas where vaccination efforts need to be intensified.
10. Tools and Resources for Rate Comparison
Several tools and resources are available to assist in rate comparison.
10.1 Statistical Software Packages
Statistical software packages such as SPSS, SAS, R, and Stata provide tools for calculating rates, performing standardization, and conducting statistical tests.
These packages also offer features for creating graphs and tables to visualize rate comparisons.
10.2 Online Calculators
Online calculators are available for calculating rates, confidence intervals, and statistical significance tests. These calculators can be useful for quick calculations and for verifying results obtained using other methods.
10.3 Public Health Databases
Public health databases such as the CDC Wonder and the WHO Global Health Observatory provide access to data on a wide range of health indicators, including rates of disease, mortality, and risk factors.
These databases can be used to compare rates across different populations and to track trends over time.
10.4 Academic Literature
Academic journals and textbooks provide detailed information on the theory and methods of rate comparison. These resources can be useful for understanding the statistical principles underlying rate comparisons and for identifying best practices.
11. Best Practices for Reporting Rate Comparisons
When reporting rate comparisons, it is important to follow best practices to ensure that the results are clear, accurate, and transparent.
11.1 Clearly Define Rates
Clearly define the rates being compared, including the numerator (number of events), the denominator (population at risk), and the time period.
11.2 Provide Context
Provide context for the rate comparisons, including information on the populations being compared, the data sources, and any relevant factors that may influence the rates.
11.3 Report Confidence Intervals
Report confidence intervals for all rates and rate ratios to provide information on the precision and reliability of the estimates.
11.4 Use Appropriate Statistical Tests
Use appropriate statistical tests to assess the significance of the differences between rates and report the p-values.
11.5 Avoid Over-Interpretation
Avoid over-interpreting small differences in rates that may be due to chance and be cautious when drawing causal inferences.
11.6 Acknowledge Limitations
Acknowledge any limitations of the data or methods used and discuss the potential impact on the results.
12. Conclusion: Making Informed Decisions with Rate Comparisons
Comparing two rates is a fundamental skill in many fields. By understanding the different methods of rate comparison, considering potential biases, and following best practices for reporting, you can make informed decisions and draw meaningful conclusions. Whether you are analyzing health data, financial data, or other types of data, the principles outlined in this article will help you to navigate the complexities of rate comparison and arrive at sound conclusions.
At COMPARE.EDU.VN, we are committed to providing you with the tools and knowledge you need to make informed decisions. If you’re looking to compare various options and need a clear, objective analysis, visit our website at COMPARE.EDU.VN. We offer a wealth of resources designed to help you compare and contrast different options across a wide range of categories.
Remember, accurate and insightful rate comparisons can lead to better strategies, improved outcomes, and a deeper understanding of the world around us.
Address: 333 Comparison Plaza, Choice City, CA 90210, United States.
Whatsapp: +1 (626) 555-9090.
Website: COMPARE.EDU.VN
Ready to make smarter choices? Explore COMPARE.EDU.VN today and see how we can assist you in making informed decisions with confidence.
13. Frequently Asked Questions (FAQ)
13.1 What is the difference between a crude rate and a standardized rate?
A crude rate is the total number of events divided by the total population and does not account for differences in population composition. A standardized rate adjusts for differences in population composition, allowing for more accurate comparisons between populations.
13.2 When should I use direct standardization versus indirect standardization?
Use direct standardization when you have stratum-specific rates for all populations being compared and want to compare what the rates would be if all populations had the same composition as the standard population. Use indirect standardization when you do not have stratum-specific rates for all populations and want to calculate a Standardized Mortality Ratio (SMR) or Standardized Incidence Ratio (SIR).
13.3 How do I choose a standard population for standardization?
Choose a standard population that is relevant to the populations being compared. This could be one of the study populations or an external reference population. The choice of standard population can affect the standardized rates, so it is important to choose a population that is meaningful in the context of the research question.
13.4 What is a rate ratio and how is it interpreted?
A rate ratio is calculated by dividing one rate by the other. A rate ratio of 1 indicates that the rates are equal. A rate ratio greater than 1 indicates that Rate 1 is higher than Rate 2, and a rate ratio less than 1 indicates that Rate 1 is lower than Rate 2.
13.5 What is a confidence interval and why is it important?
A confidence interval (CI) is a range of values that is likely to contain the true population parameter with a certain level of confidence (e.g., 95%). The width of the confidence interval reflects the precision of the estimate. Confidence intervals provide valuable information about the precision and reliability of rate comparisons and help to avoid over-interpreting small differences in rates that may be due to chance.
13.6 How do I interpret overlapping confidence intervals when comparing two rates?
If the confidence intervals of two rates overlap, this does not necessarily mean that the rates are not different, but it indicates that the difference is not statistically significant at the chosen level of confidence. Further statistical testing may be needed to determine whether the difference is statistically significant.
13.7 What statistical tests can be used to compare two rates?
For comparing two rates based on count data, the Chi-square test or Fisher’s exact test are commonly used. The choice of test depends on the sample sizes and the expected frequencies.
13.8 What are some potential biases to be aware of when comparing rates?
Potential biases include selection bias, information bias, confounding, and the ecological fallacy. It is important to be aware of these biases and to take steps to minimize their impact.
13.9 How can I control for confounding when comparing rates?
To control for confounding, use stratified analysis, standardization, or multivariable regression techniques.
13.10 Where can I find data to compare rates across different populations?
Public health databases such as the CDC Wonder and the WHO Global Health Observatory provide access to data on a wide range of health indicators, including rates of disease, mortality, and risk factors.
By understanding and applying these principles, you can effectively compare rates and make well-informed decisions based on your analysis. For more in-depth comparisons and resources, be sure to visit compare.edu.vn.