Can We Compare Maps? Absolutely! This detailed comparison guide, brought to you by COMPARE.EDU.VN, explores various methods for comparing maps, focusing on techniques to identify discrepancies, shifts, and unique features. This analysis helps in understanding the differences and similarities between spatial datasets, aiding informed decision-making and spatial data analysis. Let’s embark on a mapping comparison!
1. Understanding Map Comparison
Comparing maps is a fundamental task in various fields, including geography, urban planning, environmental science, and defense. It involves analyzing and contrasting different spatial datasets to identify similarities, differences, and patterns. Map comparison isn’t about determining which map is “better,” but about understanding the nuances and variations between them.
1.1. Why Compare Maps?
Map comparison serves several critical purposes:
- Change Detection: Identifying changes in land use, vegetation cover, or urban development over time.
- Data Validation: Assessing the accuracy and reliability of different data sources.
- Feature Extraction: Extracting specific features or patterns from multiple datasets.
- Decision Support: Providing information for informed decision-making in urban planning, resource management, and disaster response.
- Spatial Analysis: Facilitating spatial analysis and modeling by integrating information from multiple sources.
1.2. Key Challenges in Map Comparison
Several challenges can complicate the process of map comparison:
- Data Heterogeneity: Different data formats, resolutions, and accuracy levels can make direct comparison difficult.
- Geometric Distortions: Maps may contain geometric distortions due to projection differences, scanning errors, or data processing errors.
- Semantic Differences: Different maps may use different classifications, terminologies, or feature definitions.
- Computational Complexity: Analyzing large spatial datasets can be computationally intensive.
- Subjectivity: Interpretation of map differences can be subjective and depend on the analyst’s expertise and knowledge.
2. Core Concepts in Spatial Data Analysis
Before diving into specific methods, it’s crucial to understand core concepts underlying spatial data analysis.
2.1. Euclidean Distance Transform
The Euclidean distance transform (EDT) is a fundamental operation in spatial data processing. It calculates the distance from each point in a space to the nearest point in a given set of objects. This transform is particularly useful for comparing spatial datasets because it quantifies the proximity of features in one dataset to features in another.
Definition: For a point x in the plane and a point set A, the Euclidean distance transform computes the greatest lower bound of the distances between x and A. Mathematically, it can be expressed as:
EDT(x, A) = min {d(x, a) | a ∈ A}
where d(x, a) is the Euclidean distance between points x and a.
Applications:
- Proximity Analysis: Identifying areas that are close to or far from certain features.
- Feature Matching: Matching features in different datasets based on their proximity.
- Image Segmentation: Segmenting images based on distance to specific objects.
- Path Planning: Finding the shortest path between two points while avoiding obstacles.
2.2. Raster Data Representation
Raster data represents spatial information as a grid of cells, where each cell contains a value representing a specific attribute. Rasters are commonly used to represent continuous data, such as elevation, temperature, or land cover. In the context of map comparison, rasters provide a convenient way to represent distance transforms and perform statistical analysis.
Advantages of Raster Data:
- Simple Data Structure: Easy to store and process.
- Efficient Spatial Analysis: Supports a wide range of spatial analysis operations.
- Compatibility with Remote Sensing Data: Naturally compatible with satellite imagery and aerial photography.
Disadvantages of Raster Data:
- Quantization Errors: The grid structure can introduce quantization errors.
- Storage Requirements: Large raster datasets can require significant storage space.
- Limited Feature Representation: Not ideal for representing discrete features with complex geometries.
2.3. Vector Data Representation
Vector data represents spatial information as a set of discrete objects, such as points, lines, and polygons. Vectors are commonly used to represent discrete features, such as buildings, roads, or administrative boundaries.
Advantages of Vector Data:
- Precise Feature Representation: Accurately represents the geometry and location of features.
- Compact Storage: Can be more compact than raster data for representing discrete features.
- Topology Support: Supports topological relationships between features, such as connectivity and adjacency.
Disadvantages of Vector Data:
- Complex Data Structure: More complex than raster data, requiring more sophisticated data management techniques.
- Computational Complexity: Some spatial analysis operations can be computationally intensive.
- Difficult Integration with Raster Data: Integrating vector and raster data can be challenging.
3. Techniques for Map Comparison
Several techniques can be used for map comparison, each with its own strengths and limitations.
3.1. Visual Comparison
Visual comparison is the most basic and intuitive method for comparing maps. It involves visually inspecting two or more maps to identify similarities and differences. This method is useful for identifying major discrepancies, but it can be subjective and time-consuming for large datasets.
Steps:
- Overlay Maps: Overlay the maps to be compared using a GIS software or image editing tool.
- Identify Differences: Visually inspect the overlaid maps to identify differences in feature location, shape, or attribute values.
- Document Findings: Document the identified differences and their potential causes.
Advantages:
- Simple and Intuitive: Easy to understand and implement.
- Qualitative Assessment: Useful for identifying major discrepancies and patterns.
Disadvantages:
- Subjective: Depends on the analyst’s expertise and knowledge.
- Time-Consuming: Can be time-consuming for large datasets.
- Limited Quantifiable Results: Provides limited quantifiable results.
3.2. Feature-Based Comparison
Feature-based comparison involves comparing individual features in two or more maps based on their attributes and geometry. This method is useful for identifying specific differences between features, such as changes in size, shape, or location.
Steps:
- Feature Matching: Match features in the two maps based on their attributes or proximity.
- Attribute Comparison: Compare the attributes of the matched features to identify differences.
- Geometric Comparison: Compare the geometry of the matched features to identify differences in size, shape, or location.
- Document Findings: Document the identified differences and their potential causes.
Advantages:
- Detailed Comparison: Provides a detailed comparison of individual features.
- Quantifiable Results: Provides quantifiable results, such as attribute differences and geometric discrepancies.
Disadvantages:
- Requires Feature Matching: Requires accurate feature matching, which can be challenging for complex datasets.
- Time-Consuming: Can be time-consuming for large datasets.
- Sensitive to Data Quality: Sensitive to data quality and accuracy.
3.3. Raster Overlay Analysis
Raster overlay analysis involves overlaying two or more raster datasets and performing cell-by-cell comparisons. This method is useful for identifying areas of agreement and disagreement between the datasets.
Steps:
- Reproject and Resample: Reproject and resample the raster datasets to a common coordinate system and resolution.
- Overlay Rasters: Overlay the raster datasets using a GIS software.
- Perform Cell-by-Cell Comparison: Perform a cell-by-cell comparison to identify areas of agreement and disagreement.
- Document Findings: Document the identified differences and their potential causes.
Advantages:
- Comprehensive Comparison: Provides a comprehensive comparison of the entire study area.
- Quantifiable Results: Provides quantifiable results, such as the percentage of agreement and disagreement.
- Suitable for Large Datasets: Suitable for analyzing large raster datasets.
Disadvantages:
- Sensitive to Data Quality: Sensitive to data quality and accuracy.
- Requires Raster Data: Requires the data to be in raster format.
- Can Be Computationally Intensive: Can be computationally intensive for high-resolution datasets.
3.4. Change Detection Analysis
Change detection analysis involves identifying changes in land cover, vegetation, or other features over time. This method typically uses remotely sensed data, such as satellite imagery or aerial photography, to detect changes in the Earth’s surface.
Steps:
- Acquire Multi-Temporal Data: Acquire remotely sensed data for multiple time periods.
- Preprocess Data: Preprocess the data to correct for geometric and atmospheric distortions.
- Perform Change Detection: Perform change detection analysis using techniques such as image differencing, ratioing, or classification.
- Document Findings: Document the identified changes and their potential causes.
Advantages:
- Detects Changes Over Time: Specifically designed to detect changes in land cover and other features over time.
- Uses Remotely Sensed Data: Uses remotely sensed data, which can provide a comprehensive view of the Earth’s surface.
Disadvantages:
- Requires Multi-Temporal Data: Requires data for multiple time periods.
- Sensitive to Data Quality: Sensitive to data quality and atmospheric conditions.
- Can Be Computationally Intensive: Can be computationally intensive for large datasets.
3.5. Using Distance Transforms for Map Comparison
Distance transforms provide a powerful way to quantitatively compare maps by measuring the proximity of features in different datasets.
Steps:
- Compute Distance Transforms: Compute the Euclidean distance transform for each dataset. This involves calculating the distance from each point in the plane to the nearest feature in the dataset.
- Overlay Distance Transforms: Overlay the distance transforms of the two datasets. This creates a composite map where each point is assigned a value representing its distance to the nearest feature in both datasets.
- Analyze the Overlay: Analyze the overlaid distance transforms to identify areas of agreement and disagreement. Areas where the distance values are similar indicate agreement, while areas where the distance values are significantly different indicate disagreement.
- Statistical Analysis: Perform statistical analysis on the distance values to quantify the discrepancies between the datasets. This can involve calculating summary statistics, such as the mean, standard deviation, and range of distance values, as well as creating histograms to visualize the distribution of distances.
Advantages:
- Quantitative Comparison: Provides a quantitative measure of the discrepancies between the datasets.
- Comprehensive Analysis: Considers the entire study area, not just individual features.
- Robust to Data Heterogeneity: Can be used to compare datasets with different resolutions and accuracy levels.
Disadvantages:
- Requires Raster Data: Requires the data to be in raster format.
- Can Be Computationally Intensive: Can be computationally intensive for large datasets.
- Interpretation Can Be Complex: Interpretation of the distance values can be complex, requiring expertise in spatial data analysis.
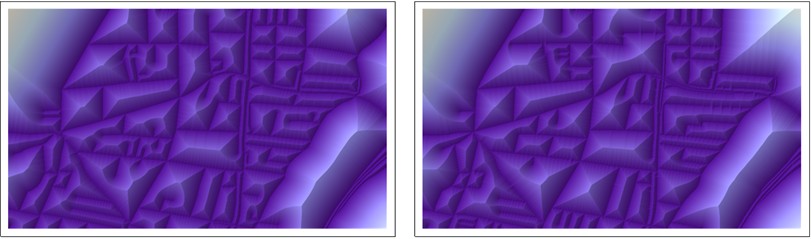
This figure illustrates the distance transforms of two datasets, B (left) and R (right), in a pseudo-relief representation, highlighting the spatial distribution and proximity of features.
4. Statistical Analysis of Differences
After overlaying the distance transforms, statistical analysis can provide deeper insights into the discrepancies between the datasets.
4.1. Descriptive Statistics
Descriptive statistics can be used to summarize the distribution of distance values. Common descriptive statistics include:
- Mean: The average distance value.
- Standard Deviation: A measure of the spread of the distance values.
- Minimum: The smallest distance value.
- Maximum: The largest distance value.
- Median: The middle distance value.
These statistics can be used to compare the overall similarity of the datasets and identify areas of significant difference.
4.2. Histograms
Histograms provide a visual representation of the distribution of distance values. They can be used to identify patterns and trends in the data, such as the presence of outliers or clusters of high or low distance values.
Interpretation:
- Shape: The shape of the histogram can indicate whether the data is normally distributed, skewed, or multimodal.
- Central Tendency: The center of the histogram indicates the typical distance value.
- Spread: The spread of the histogram indicates the variability of the distance values.
- Outliers: Outliers are values that are far from the main body of the data and may indicate errors or anomalies.
This histogram compares the frequency distribution of distances between blue and red features. Note the logarithmic scale on the horizontal axis.
4.3. Spatial Statistics
Spatial statistics can be used to analyze the spatial distribution of distance values. Common spatial statistics include:
- Spatial Autocorrelation: A measure of the degree to which nearby distance values are similar.
- Hot Spot Analysis: A method for identifying clusters of high or low distance values.
- Geostatistics: A set of techniques for modeling and predicting spatial variation in distance values.
These statistics can be used to identify areas where the datasets are most different and to understand the spatial patterns of those differences.
5. Implementing Map Comparison Techniques
Implementing map comparison techniques requires the use of GIS software and statistical analysis tools.
5.1. GIS Software
GIS (Geographic Information System) software is essential for performing map comparison tasks. Popular GIS software packages include:
- ArcGIS: A comprehensive GIS software package developed by Esri. It provides a wide range of tools for spatial data analysis, mapping, and visualization.
- QGIS: A free and open-source GIS software package. It is a powerful alternative to ArcGIS and provides many of the same features.
- GRASS GIS: A free and open-source GIS software package. It is particularly well-suited for raster data analysis and environmental modeling.
5.2. Statistical Analysis Tools
Statistical analysis tools are necessary for performing statistical analysis of the distance values. Popular statistical analysis tools include:
- R: A free and open-source statistical computing environment. It provides a wide range of statistical functions and packages for spatial data analysis.
- SPSS: A commercial statistical software package. It is widely used in social sciences, business, and healthcare.
- SAS: A commercial statistical software package. It is widely used in business, government, and research.
- Python: A versatile programming language with libraries like NumPy, SciPy, and Pandas that are excellent for statistical analysis.
6. Case Studies
To illustrate the application of map comparison techniques, consider the following case studies:
6.1. Urban Expansion Analysis
Urban expansion analysis involves comparing maps of urban areas at different time periods to identify changes in urban extent and density. This analysis can be used to understand the patterns and drivers of urban growth and to assess the impacts of urbanization on the environment and society.
Data:
- Historical maps of urban areas.
- Satellite imagery.
- Aerial photography.
Techniques:
- Raster overlay analysis.
- Change detection analysis.
- Distance transforms.
Applications:
- Urban planning.
- Transportation planning.
- Environmental management.
6.2. Land Cover Change Analysis
Land cover change analysis involves comparing maps of land cover at different time periods to identify changes in land use and vegetation cover. This analysis can be used to understand the impacts of deforestation, agriculture, and other human activities on the environment.
Data:
- Land cover maps.
- Satellite imagery.
- Aerial photography.
Techniques:
- Raster overlay analysis.
- Change detection analysis.
- Distance transforms.
Applications:
- Environmental monitoring.
- Resource management.
- Climate change research.
6.3. Infrastructure Mapping Comparison
Comparing infrastructure maps from different sources or time periods helps identify discrepancies, updates, and potential errors in mapping data. This is crucial for urban planning, disaster management, and utility maintenance.
Data:
- Maps of roads, buildings, utility lines, and other infrastructure.
- Data from different mapping agencies or private companies.
Techniques:
- Feature-based comparison.
- Visual overlay analysis.
- Distance transforms to highlight differences in feature placement.
Applications:
- Urban planning and development.
- Emergency response planning.
- Maintenance of public utilities.
7. Optimizing Map Comparison for Specific Use Cases
The best approach to map comparison often depends on the specific use case. Here are some considerations for tailoring your approach:
7.1. Understanding the Data
Before starting any map comparison, it’s crucial to have a deep understanding of the data involved. This includes:
- Data Sources: Where did the data come from?
- Data Collection Methods: How was the data collected (e.g., remote sensing, field surveys)?
- Data Accuracy: What is the known accuracy of the data?
- Data Resolution: What is the spatial resolution of the data?
- Data Formats: What formats are the data in (e.g., shapefile, GeoTIFF)?
Understanding these factors will help you choose the appropriate comparison techniques and interpret the results.
7.2. Defining Clear Objectives
What do you hope to achieve with the map comparison? Are you trying to:
- Detect changes over time?
- Validate the accuracy of one dataset against another?
- Identify areas of disagreement between different data sources?
- Extract specific features or patterns?
Having clear objectives will help you focus your analysis and avoid wasting time on irrelevant tasks.
7.3. Selecting Appropriate Tools and Techniques
The best tools and techniques for map comparison will depend on the data, objectives, and available resources. Some factors to consider include:
- Data Format: Raster data is best suited for raster overlay analysis and change detection, while vector data is better for feature-based comparison.
- Data Size: Large datasets may require more efficient algorithms and computing resources.
- Data Complexity: Complex datasets with many features or attributes may require more sophisticated analysis techniques.
- Available Software: Choose tools that you are familiar with and that are appropriate for the task.
- Available Expertise: Consider the level of expertise required to perform the analysis and interpret the results.
7.4. Considering Scale and Resolution
The scale and resolution of the data can significantly impact the results of a map comparison. For example, a comparison of two maps at different scales may reveal differences that are simply due to the level of detail shown.
- Scale: The ratio between the distance on a map and the corresponding distance on the ground.
- Resolution: The level of detail that can be represented on a map.
It’s important to choose data with appropriate scales and resolutions for the analysis and to be aware of the limitations of the data.
8. Ensuring Data Quality and Accuracy
Data quality and accuracy are critical for map comparison. Errors or inaccuracies in the data can lead to misleading results.
8.1. Data Validation
Before starting any map comparison, it’s important to validate the data to ensure that it is accurate and reliable. This can involve:
- Checking for errors in the data.
- Comparing the data to other sources of information.
- Performing field surveys to verify the accuracy of the data.
8.2. Data Cleaning
Data cleaning involves correcting errors and inconsistencies in the data. This can include:
- Removing duplicate records.
- Correcting spelling errors.
- Standardizing data formats.
- Filling in missing values.
8.3. Geometric Correction
Geometric correction involves correcting for distortions in the geometry of the data. This can be done using techniques such as:
- Rubber sheeting: A method for stretching and warping the data to fit a control dataset.
- Image rectification: A method for correcting geometric distortions in remotely sensed data.
8.4. Addressing Positional Errors
Positional errors can significantly impact the results of map comparisons. Common methods to address these include:
- Triangulation: Using known control points to refine the positions of features.
- Buffering: Creating buffer zones around features to account for uncertainty in their location.
- Fuzzy Matching: Allowing for some degree of positional error when matching features between datasets.
9. Common Pitfalls to Avoid
Map comparison can be a complex process, and it’s easy to make mistakes. Here are some common pitfalls to avoid:
- Using Data with Different Projections: Make sure that all the data is in the same projection before starting the comparison.
- Ignoring Data Quality Issues: Data quality issues can significantly impact the results of the comparison.
- Not Defining Clear Objectives: Without clear objectives, it’s easy to get lost in the details and waste time on irrelevant tasks.
- Over-Interpreting the Results: Be careful not to over-interpret the results of the comparison. Map comparison is just one tool for understanding spatial patterns and processes.
- Neglecting Metadata: Always review the metadata associated with datasets to understand their limitations, accuracy, and appropriate uses.
10. Future Trends in Map Comparison
Map comparison is an evolving field, and new technologies and techniques are constantly emerging. Some future trends to watch out for include:
- Artificial Intelligence (AI) and Machine Learning (ML): AI and ML are being used to automate and improve map comparison tasks, such as feature extraction and change detection.
- Cloud Computing: Cloud computing is making it easier to store and process large spatial datasets.
- Big Data Analytics: Big data analytics are being used to analyze large volumes of spatial data and identify patterns and trends.
- Real-Time Mapping: Real-time mapping is providing up-to-date information about the Earth’s surface, which can be used for a variety of applications, such as disaster response and traffic management.
- Integration of 3D Data: As 3D data becomes more readily available, map comparison techniques will need to incorporate 3D information to provide a more complete understanding of the Earth’s surface.
- Improved Visualization Techniques: Advances in visualization technology will allow for more intuitive and informative displays of map comparison results.
11. Frequently Asked Questions (FAQs)
-
What is the Euclidean distance transform?
The Euclidean distance transform calculates the distance from each point in a space to the nearest point in a given set of objects.
-
Why is data quality important in map comparison?
Poor data quality can lead to misleading results and inaccurate conclusions.
-
What are the advantages of using raster data for map comparison?
Raster data is easy to store and process, supports a wide range of spatial analysis operations, and is compatible with remote sensing data.
-
What are the disadvantages of using vector data for map comparison?
Vector data is more complex than raster data, requires more sophisticated data management techniques, and can be computationally intensive.
-
What is change detection analysis?
Change detection analysis involves identifying changes in land cover, vegetation, or other features over time.
-
How can statistical analysis be used to compare maps?
Statistical analysis can be used to quantify the discrepancies between maps and to identify areas where the maps are most different.
-
What is the role of GIS software in map comparison?
GIS software provides a wide range of tools for spatial data analysis, mapping, and visualization.
-
How can AI and ML be used to improve map comparison?
AI and ML can be used to automate and improve map comparison tasks, such as feature extraction and change detection.
-
What are some common pitfalls to avoid in map comparison?
Common pitfalls include using data with different projections, ignoring data quality issues, and not defining clear objectives.
-
What future trends are expected in map comparison?
Future trends include the use of AI and ML, cloud computing, big data analytics, real-time mapping, and the integration of 3D data.
-
What is the difference between scale and resolution in map comparison?
Scale refers to the ratio between the distance on a map and the corresponding distance on the ground, while resolution refers to the level of detail that can be represented on a map.
12. Conclusion: Making Informed Decisions with Map Comparisons
Comparing maps is an essential process for understanding spatial patterns, detecting changes, and making informed decisions in various fields. By using appropriate techniques and tools, and by paying attention to data quality and accuracy, you can gain valuable insights from map comparisons. Remember, the goal is not to determine which map is “better,” but to understand the nuances and variations between them.
COMPARE.EDU.VN is dedicated to providing comprehensive and objective comparisons to help you make informed decisions. We understand the challenges in comparing complex spatial datasets. That’s why we offer detailed analyses and user-friendly tools to simplify the process.
Ready to Explore More?
Are you ready to make smarter, more informed decisions? Visit COMPARE.EDU.VN today to explore detailed comparisons and comprehensive analyses that will guide you in every choice.
Address: 333 Comparison Plaza, Choice City, CA 90210, United States
WhatsApp: +1 (626) 555-9090
Website: COMPARE.EDU.VN
Let compare.edu.vn be your trusted partner in making well-informed decisions. Start exploring, comparing, and deciding with confidence today! We will make your product comparison easier.